Analytici Bank of America ve středu v poznámce uvedli, že kvantové počítání „by mohlo být největší revolucí pro lidstvo od objevu ohně“.
Analytici společnosti tvrdí, že by mohlo dojít k resetování globálních mocenských struktur a nastání éry bezprecedentních inovací.
„Člověk by musel provádět jeden výpočet za sekundu po dobu přibližně 50 kvintilionů let, aby dosáhl toho, co kvantový počítač zvládne za jednu sekundu,“ píše BofA.
Analytici popsali kvantové počítání jako „technologii, která dokáže provádět nekonečné množství složitých výpočtů v nulovém čase a urychlit lidské poznání a vývoj“.
Ačkoli plná kvantová výhoda ještě nebyla dosažena kvůli systémům náchylným k chybám, BofA uvedla, že technologie se blíží zralosti, přičemž termín pro široké využití se odhaduje na období mezi lety 2030 a 2033.
„Výzvou je zvýšit počet a kvalitu kubitů,“ poznamenali analytici a jako klíčové vývojové trendy uvedli čipy nové generace a zlepšení věrnosti kubitů.
BofA vidí potenciální trh s aplikacemi v hodnotě 2 bilionů dolarů do roku 2035, ale dodává, že „skutečné číslo by mohlo být globální HDP“, vzhledem k potenciálu kvantové technologie revolucionalizovat šifrování, objevování nových léků, logistiku, hluboké učení a materiálové vědy.
Klíčové je, že kombinace kvantového počítání a generativní AI by mohla přinést to, co BofA nazývá „umělá superinteligence“. Firma uvedla, že „QC s pouhými 10 kubity by mohl provést 100krát více operací než klasický počítač“, což by ho činilo ideálním pro urychlení trénování generativních AI modelů.
BofA varovala, že „kdokoli vyhraje ‚kvantový závod‘, získá bezprecedentní geopolitickou, technologickou a ekonomickou výhodu“.
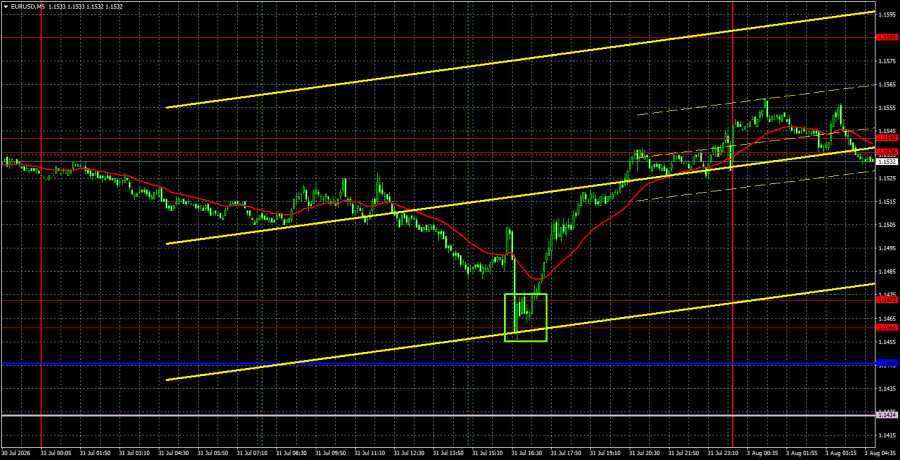
The EUR/USD currency pair initially traded lower on Friday, then resumed explosive growth. Recall that last week the market finally began to pay attention to positive factors for the euro, leading to a significant strengthening of the European currency. Disappointment with the Federal Reserve, strong GDP data in Europe, weak GDP data in the U.S., and accelerating inflation in Germany and the Eurozone in July all contributed to a sharp decline in the dollar across markets. The question remains: what to expect next. In our view, the growth of the European currency should continue in the medium term. We see no valid reasons for the dollar's strengthening, just as there were none a few months ago. The American currency in 2026 has squeezed the maximum from the current news backdrop, but even that has not led to significant long-term growth in the dollar (on daily and weekly timeframes). Essentially, the pair remains flat on the weekly chart, which means that the dollar still cannot count on strong growth. Over the weekend, it became known that Donald Trump had decided against carrying out new strikes on Iran, which does not affect the overall situation in the Middle East. The conflict persists, traffic through the Strait of Hormuz is heavily restricted, and negotiations are not taking place.
From a technical perspective, the pair has exited the sideways channel of 1.1362-1.1461 after a month of struggling. Traders can now expect not just an upward trend, but a full-fledged trend. Recall that over the past year, the EUR/USD pair has predominantly traded sideways, and there are still no strong foundations for a long-term dollar trend.
On the 5-minute timeframe, one very good trading signal was formed on Friday. During the American trading session, the price dropped to the 1.1461-1.1473 area and bounced back. Thus, traders had an excellent opportunity to go long. Before the end of the day, the pair managed to reach the nearest target area of 1.1536-1.1542.
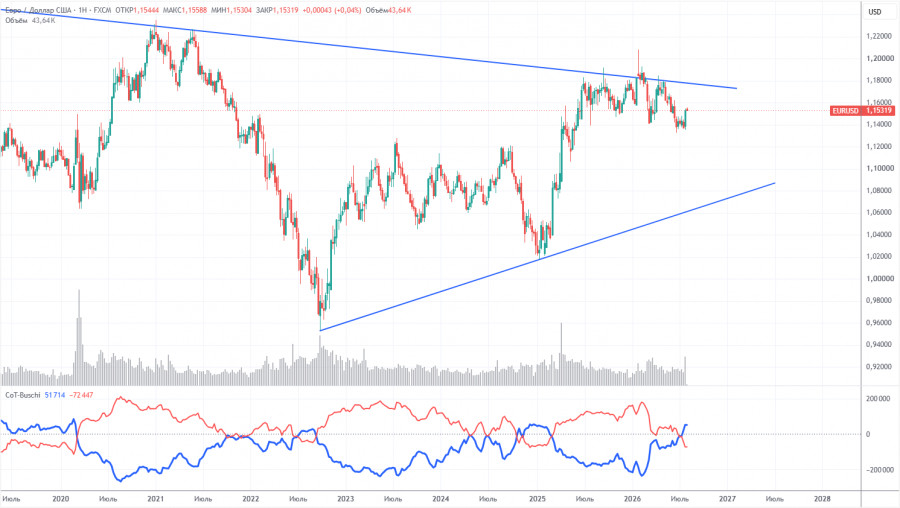
The latest COT report is dated July 28. The weekly timeframe illustration clearly shows that the net position of non-commercial traders has become "bearish" and has significantly decreased in 2026 due to geopolitical events. Traders have been shedding the European currency in favor of the U.S. dollar in recent months. Donald Trump's policy has remained unchanged, but for a time the dollar was acting as a "reserve currency."
We still do not see any fundamental factors for strengthening the European currency, while there are plenty of factors for the decline of the American one. The war in the Middle East made the dollar temporarily super attractive, but once this factor has "expired," everything will return to normal. In the long term, the euro could drop to the level of $1.08 (the trend line), but the upward trend will still remain relevant. However, over the past few months of dollar growth, the pair has not drawn significantly closer to this line.
The position of the red and blue lines of the indicator indicates parity between bulls and bears. During the last reporting week, the number of longs in the "non-commercial" group decreased by 15,500, while the number of shorts increased by 15,600. Accordingly, the net position decreased by 31,100 contracts for the week.
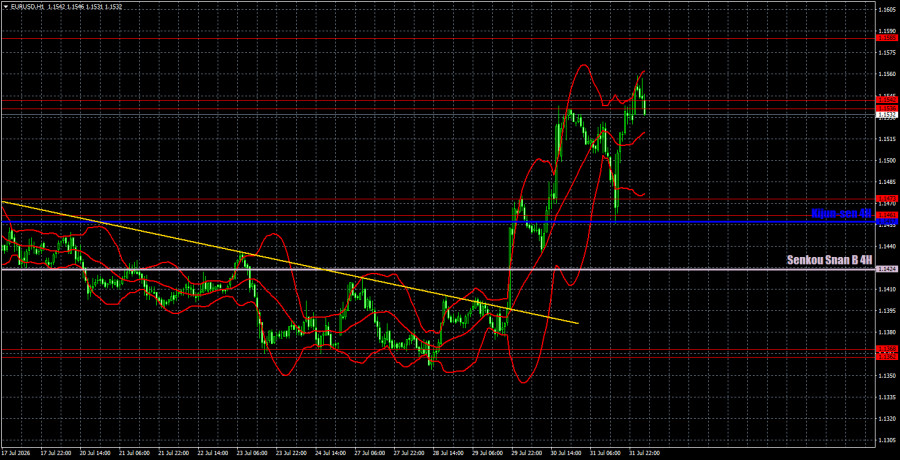
On the hourly timeframe, the pair began a new upward trend after a month-long pause. The situation in the Middle East remains tense and is not improving, but that is not enough for a new, powerful surge in the dollar. The market has ignored all the positive backdrop for the euro in recent months and has focused solely on the Fed's monetary policy. If the situation has now changed, the European currency has the opportunity to process all past news/events/reports that the market has disregarded.
For August 3, we highlight the following levels for trading — 1.1234, 1.1274, 1.1362-1.1368, 1.1461-1.1473, 1.1536-1.1542, 1.1585, 1.1657-1.1666, 1.1750-1.1760, 1.1786, 1.1830-1.1837, as well as the Senkou Span B line (1.1424) and the Kijun-sen line (1.1457). The Ichimoku indicator lines may move during the day, which should be taken into account when determining trading signals. Don't forget to set a Stop Loss order in breakeven if the price moves in the right direction by 15 pips. This will protect against potential losses if the signal proves false.
On Monday, a retail sales report will be released in Germany, the second estimate of the Eurozone manufacturing PMI will be published, and a significant ISM manufacturing index will be released in the U.S. Thus, all attention is on the ISM index.
Today, traders may consider short positions with targets of 1.1461-1.1473 if the price consolidates below the 1.1536-1.1542 area. Consolidation above the area of 1.1536-1.1542 will allow for new long positions with targets of 1.1585 and 1.1657-1.1666.
Support and resistance price levels are thick red lines around which movement might end. They are not sources of trading signals.
The Kijun-sen and Senkou Span B lines are Ichimoku indicator lines transferred to the hourly timeframe from the 4-hour one. They are strong lines.
Extreme levels are thin red lines from which the price has previously bounced. They are sources of trading signals.
Yellow lines represent trend lines, trend channels, and any other technical patterns.
Indicator 1 on the COT charts indicates the size of the net position of each category of traders.
ລິ້ງດ່ວນ
ForexMart is authorized and regulated in various jurisdictions.
(Reg No.23071, IBC 2015) with a registered office at First Floor, SVG Teachers Co-operative Credit Union Limited Uptown Building, Corner of James and Middle Street, Kingstown, Saint Vincent and the Grenadines
Restricted Regions: the United States of America, North Korea, Sudan, Syria and some other regions.


















 ຕິດຕໍ່ພວກເຮົາ